Last week Peter Sabev gave his talk "On Reporting Bugs: Errors Made and Lessons learned" for DEV.bg (watch in Bulgarian). At the end of the talk there was a quick question how would he approach automation. I have always approached automation in terms of manpower and skills available within the team while he proposed an approach based on return of investment.
Given that you have a team with strong understanding of the software (code) under test and they have good coding skills then start with the hardest test cases first. This way the team will have lots of hard work upfront and there will be some lead time without visible results. However when the hardest/most complex test cases are already automated you will most likely have covered a big portion of the SUT.
On the contrary, when you start with the easiest test cases first then the team will progress gradually and have enough time to get to grips with the SUT. You are also more likely to see more regressions or bugs missed. With this approach every subsequent automated test will be harder to write and more complex than the previous one. This is a good fit for team who don't have strong experience with test automation and/or are unfamiliar with the product.
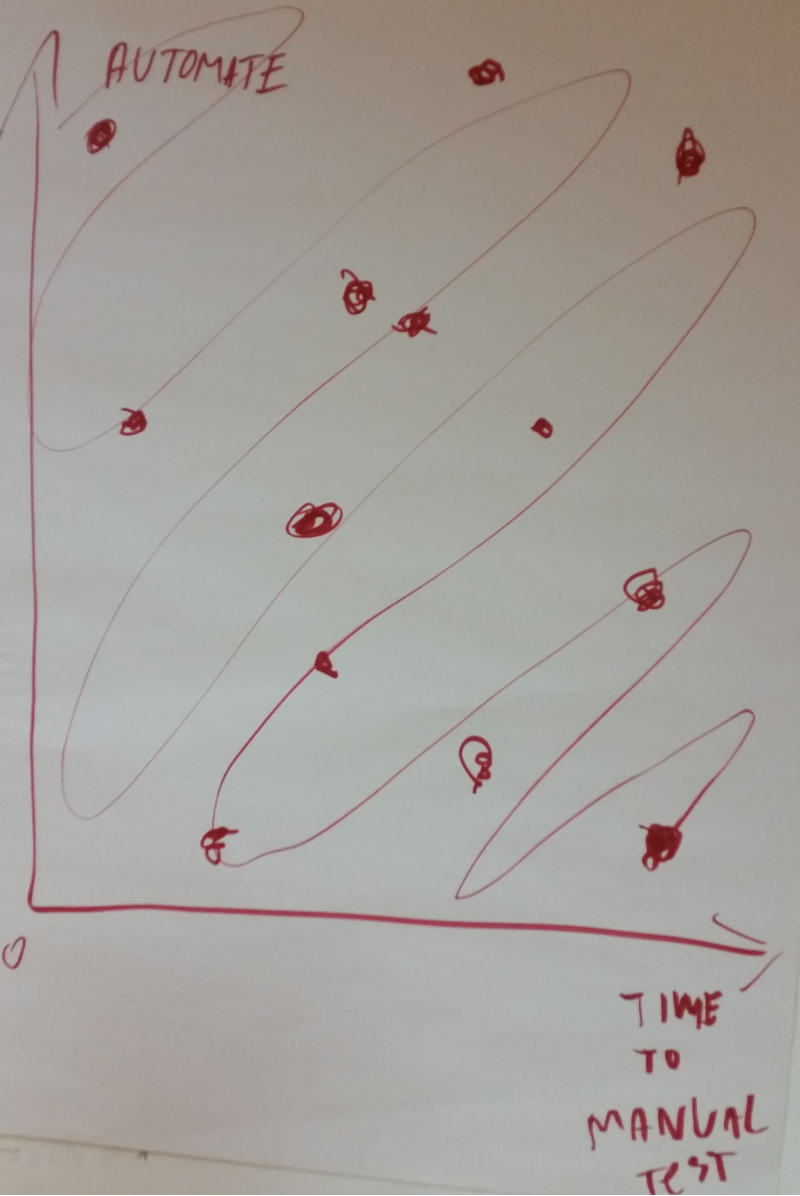
Peter proposes a different approach. He plots the test cases as dots, based on how much time they take to execute manually and how much time/how hard is it to automate the particular case. Then you start to move from the lower right corner towards the upper left corner in a weaving motion, like a snake,
His argument is that once you automate the test cases which are not very complex but require lots of time to execute by hand then you free up resources within the team. As you progress up the chart the test cases become harder to automate and yield less return of investment because they don't take some much time to execute manually.
For more information about Peter's approach please read his article.
As you can see from the snake chart the team constantly faces test scenarios jumping up and down on the automation hardness scale. Which also means that you need to have the suitable skills within the team. IMO this is best suited for teams where each member has different degree of experience. I'm also in favor of using the snake chart as a tool to distribute automation tasks within the team.
If you'd like to hear more about Peter's and mine views on manual vs. automated testing be sure to follow DEV.bg. We are going to host a discussion on October 18th so stay tuned!
Comments !