Bug in Nokia software shows wrong caller ID
During the past month one of my cell phones,
Nokia
5800 XpressMusic
, was not showing the caller name when a friend was calling.
The number in the contacts list was correct but the name wasn't showing,
nor the custom assigned ringing tone. It turned out to be a bug!
The story behind this is that accidentally the same number was saved again in the contacts list, but without a name assigned to it. The software was matching the later one, so no custom ringing tone, no name shown. Removing the duplicate entry fixed the issue. Software version of this phone is
v 21.0.025
RM-356
02-04-09
I wondered what will happen with multiple duplicates and if this was fixed in a later
software version so I tested with another phone,
Nokia 6303.
Software version is
V 07.10
25-03-10
RM-638
- Step 0 - add the number to the contacts list, with name
Buddy 1 - Step 1 - add the same number to the contacts, with empty name.
Result: You get a warning this number is already present for
Buddy 1! When receiving a call,Buddy 1is displayed. - Step 2 - edit the empty name contact and change the name to
Buddy 2. Result: when receiving a callBuddy 2is displayed. - Step 3 - add the same number again, with name
Buddy 0. This is the latest entry but it is sorted before the previous two (this is important). Result: You get a warning that this number is already present forBuddy 1andBuddy 2. When receiving a callBuddy 0is displayed.
Summary: so it looks like Nokia fixed the issue with empty names, by simply ignoring them but when multiple duplicate contacts are available it displays the name of the last entered in the contact list, independent of name sort order.
Later today or tomorrow I will test on
Nokia 700
which runs Symbian OS and update this post with more results.
Updated on 2013-03-19 23:50
Finally managed to test on
Nokia 700.
Software version is:
Release
Nokia Belle Feature pack 1
Software version
112.010.1404
Software version date
2012-03-30
Type
RM-670
Result: If a duplicate contact entry is present it doesn't matter if the name is empty or not. Both times no name was displayed when receiving a call. Looks like Nokia is not paying attention to regressions at all.
Android and iPhone
I don't own any
Android
or
iPhone
devices so I'm not able to test on them. If you have one, please let me know if this bug is still present
and how does the software behave when multiple contacts share the same number or have empty names! Thanks!
There are comments.
Performance Test: Amazon EBS vs. Instance Storage, Pt.1
I'm exploring the possibility to speed-up my cloud database so I've run some basic tests against storage options available to Amazon EC2 instances. The instance was m1.large with High I/O performance and two additional disks with the same size:
- /dev/xvdb - type EBS
- /dev/xvdc - type instance storage
Both are Xen para-virtual disks. The difference is that EBS is persistent across reboots while instance storage is ephemeral.
hdparm
For a quick test I used hdparm. The manual says:
-T  Perform timings of cache reads for benchmark and comparison purposes.
    This displays the speed of reading directly from the Linux buffer cache
    without disk access. This measurement is essentially an indication of
    the throughput of the processor, cache, and memory of the system under test.

-t  Perform timings of device reads for benchmark and comparison purposes.
    This displays the speed of reading through the buffer cache to the disk
    without any prior caching of data. This measurement is an indication of how
    fast the drive can sustain sequential data reads under Linux, without any
    filesystem overhead.
The results of 3 runs of hdparm are shown below:
# hdparm -tT /dev/xvdb /dev/xvdc

/dev/xvdb:
 Timing cached reads:   11984 MB in  1.98 seconds = 6038.36 MB/sec
 Timing buffered disk reads:  158 MB in  3.01 seconds =  52.52 MB/sec

/dev/xvdc:
 Timing cached reads:   11988 MB in  1.98 seconds = 6040.01 MB/sec
 Timing buffered disk reads:  1810 MB in  3.00 seconds = 603.12 MB/sec


# hdparm -tT /dev/xvdb /dev/xvdc

/dev/xvdb:
 Timing cached reads:   11892 MB in  1.98 seconds = 5991.51 MB/sec
 Timing buffered disk reads:  172 MB in  3.00 seconds =  57.33 MB/sec

/dev/xvdc:
 Timing cached reads:   12056 MB in  1.98 seconds = 6075.29 MB/sec
 Timing buffered disk reads:  1972 MB in  3.00 seconds = 657.11 MB/sec


# hdparm -tT /dev/xvdb /dev/xvdc

/dev/xvdb:
 Timing cached reads:   11994 MB in  1.98 seconds = 6042.39 MB/sec
 Timing buffered disk reads:  254 MB in  3.02 seconds =  84.14 MB/sec

/dev/xvdc:
 Timing cached reads:   11890 MB in  1.99 seconds = 5989.70 MB/sec
 Timing buffered disk reads:  1962 MB in  3.00 seconds = 653.65 MB/sec
Result: Sequential reads from instance storage are 10x faster compared to EBS on average.
IOzone
I'm running MySQL and sequential data reads are probably over idealistic scenario. So I found another benchmark suite, called IOzone. I used the 3-414 version built from the official SRPM.
IOzone performs multiple tests. I'm interested in read/re-read, random-read/write, read-backwards and stride-read.
For this round of testing I've tested with ext4 filesystem with and without journal on both types of disks. I also experimented running Iozone inside a ramfs mounted directory. However I didn't have the time to run the test suite multiple times.
Then I used iozone-results-comparator to visualize the results. (I had to do a minor fix to the code to run inside virtualenv and install all missing dependencies).
Raw IOzone output, data visualization and the modified tools are available in the aws_disk_benchmark_w_iozone.tar.bz2 file (size 51M).
Graphics
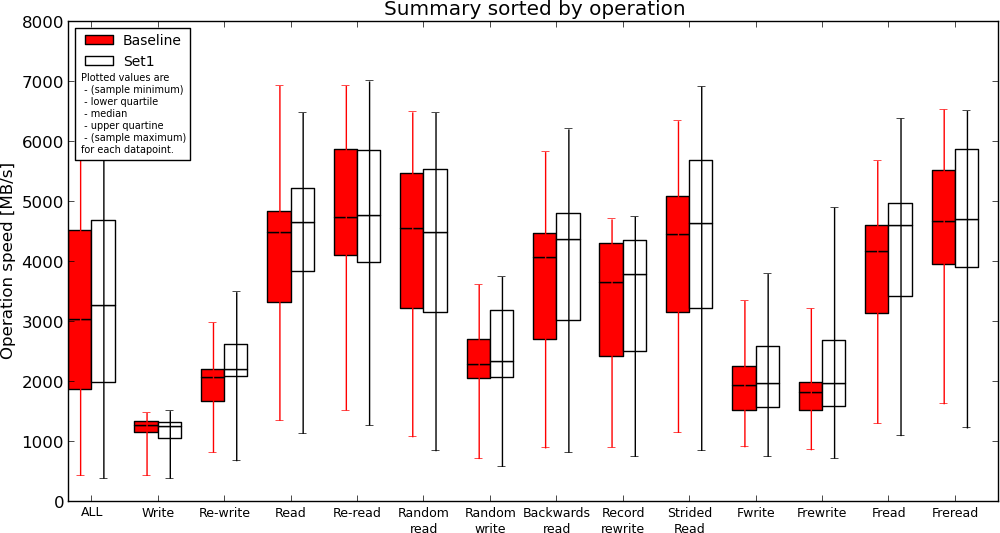
EBS without journal(Baseline) vs. Instance Storage without journal(Set1)

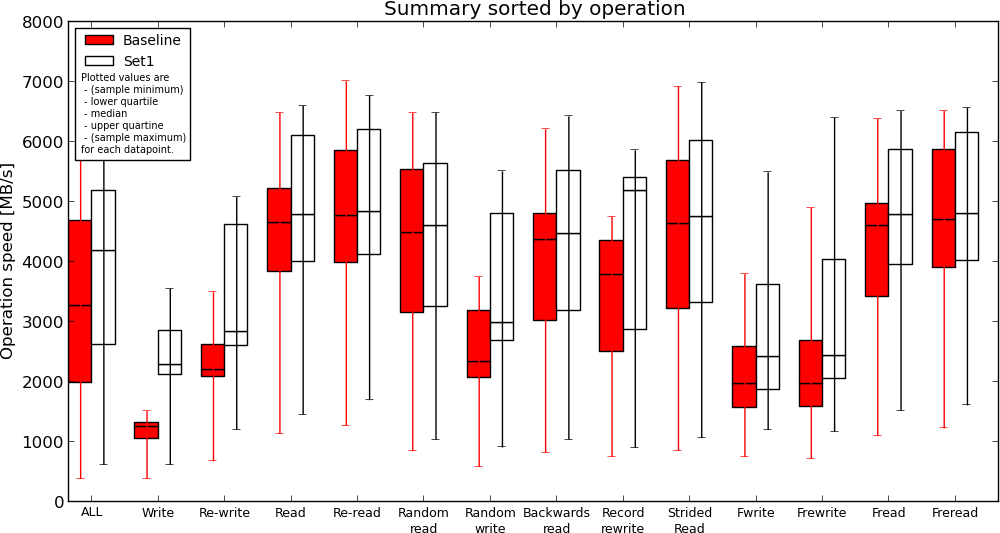
Instance Storage without journal(Baseline) vs. Ramfs(Set1)

Results
- ext4 journal has no effect on reads, causes slow down when writing to disk. This is expected;
- Instance storage is faster compared to EBS but not much. If I understand the results correctly, read performance is similar in some cases;
- Ramfs is definitely the fastest but read performance compared to instance storage is not two-fold (or more) as I expected;
Conclusion
Instance storage appears to be faster (and this is expected) but I'm still not sure if my application will gain any speed improvement or how much if migrated to read from instance storage (or ramfs) instead of EBS. I will be performing more real-world test next time, by comparing execution time for some of my largest SQL queries.
If you have other ideas how to adequately measure I/O performance in the AWS cloud, please use the comments below.
There are comments.
Performance test of MD5, SHA1, SHA256 and SHA512
A few months ago I wrote
django-s3-cache.
This is Amazon Simple Storage Service (S3) cache backend for Django
which uses hashed file names.
django-s3-cache uses sha1 instead of md5 which appeared to be
faster at the time. I recall that my testing wasn't very robust so I did another
round.
Test Data
The file urls.txt contains 10000 unique paths from the dif.io website and looks like this:
/updates/Django-1.3.1/Django-1.3.4/7858/
/updates/delayed_paperclip-2.4.5.2 c23a537/delayed_paperclip-2.4.5.2/8085/
/updates/libv8-3.3.10.4 x86_64-darwin-10/libv8-3.3.10.4/8087/
/updates/Data::Compare-1.22/Data::Compare-Type/8313/
/updates/Fabric-1.4.0/Fabric-1.4.4/8652/
Test Automation
I used the standard timeit module in Python.
#!/usr/bin/python

import timeit

t = timeit.Timer(
"""
import hashlib
for line in url_paths:
    h = hashlib.md5(line).hexdigest()
#    h = hashlib.sha1(line).hexdigest()
#    h = hashlib.sha256(line).hexdigest()
#    h = hashlib.sha512(line).hexdigest()
"""
,
"""
url_paths = []
f = open('urls.txt', 'r')
for l in f.readlines():
    url_paths.append(l)
f.close()
"""
)

print t.repeat(repeat=3, number=1000)
Test Results
The main statement hashes all 10000 entries one by one. This statement is executed 1000 times in a loop, which is repeated 3 times. I have Python 2.6.6 on my system. After every test run the system was rebooted. Execution time in seconds is available below.
MD5     10.275190830230713, 10.155328989028931, 10.250311136245728
SHA1    11.985718965530396, 11.976419925689697, 11.86873197555542
SHA256  16.662450075149536, 21.551337003707886, 17.016510963439941
SHA512  18.339390993118286, 18.11187481880188,  18.085782051086426
Looks like I was wrong the first time! MD5 is still faster but not that much. I will stick with SHA1 for the time being.
If you are interested in Performance Testing checkout the
performance testing books on Amazon.
As always I’d love to hear your thoughts and feedback. Please use the comment form below.
Python 2.7 vs. 3.6 and BLAKE2
UPDATE: added on June 9th 2017
After request from my reader refi64 I've tested this again between different versions of Python and included a few more hash functions. The test data is the same, the test script was slightly modified for Python 3:
import timeit

print (timeit.repeat(
"""
import hashlib
for line in url_paths:
#    h = hashlib.md5(line).hexdigest()
#    h = hashlib.sha1(line).hexdigest()
#    h = hashlib.sha256(line).hexdigest()
#    h = hashlib.sha512(line).hexdigest()
#    h = hashlib.blake2b(line).hexdigest()
    h = hashlib.blake2s(line).hexdigest()
"""
,
"""
url_paths = [l.encode('utf8') for l in open('urls.txt', 'r').readlines()]
""",
repeat=3, number=1000))
Test was repeated 3 times for each hash function and the best time was taken into account. The test was performed on a recent Fedora 26 system. The results are as follows:
Python 2.7.13

MD5     [13.94771409034729, 13.931367874145508, 13.908519983291626]
SHA1    [15.20741891860962, 15.241390943527222, 15.198163986206055]
SHA256  [17.22162389755249, 17.229840993881226, 17.23402190208435]
SHA512  [21.557533979415894, 21.51376700401306, 21.522911071777344]


Python 3.6.1

MD5     [11.770181038000146, 11.778772834999927, 11.774679265000032]
SHA1    [11.5838599839999, 11.580340686999989, 11.585769942999832]
SHA256  [14.836309305999976, 14.847088003999943, 14.834776135999846]
SHA512  [19.820048629999746, 19.77282728099999, 19.778471210000134]

BLAKE2b [12.665497404000234, 12.668979115000184, 12.667314543999964]
BLAKE2s [11.024885618000098, 11.117366972000127, 10.966767880999669]
- Python 3 is faster than Python 2
- SHA1 is a bit faster than MD5, maybe there's been some optimization
- BLAKE2b is faster than SHA256 and SHA512
- BLAKE2s is the fastest of all functions
Note: BLAKE2b is optimized for 64-bit platforms, like mine and I thought it will be faster than BLAKE2s (optimized for 8- to 32-bit platforms) but that's not the case. I'm not sure why is that though. If you do, please let me know in the comments below!
There are comments.
Mission Impossible - ABRT Bugzilla Plugin on RHEL6
Some time ago Red Hat introduced Automatic Bug Reporting Tool to their Red Hat Enterprise Linux platform. This is a nice tool which lets users report bugs easily to Red Hat. However one of the plugins in the latest version doesn't seem usable at all.
First make sure you have libreport-plugin-bugzilla package installed. This is the plugin to
report bugs directly to Bugzilla. It may not be installed by default
because customers are supposed to report issues to Support first - this is why they pay anyway.
If you are a tech savvy user though, you may want to skip Support and go straight to the developers.
To enable Bugzilla plugin:
- Edit the file
/etc/libreport/events.d/bugzilla_event.confchange the lineEVENT=report_Bugzilla analyzer=libreport reporter-bugzilla -b
to
EVENT=report_Bugzilla reporter-bugzilla -b
-
Make sure ABRT will collect meaningful backtrace. If debuginfo is missing it will not let you continue. Edit the file
/etc/libreport/events.d/ccpp_event.conf. There should be something like this:EVENT=analyze_LocalGDB analyzer=CCpp abrt-action-analyze-core --core=coredump -o build_ids && abrt-action-generate-backtrace && abrt-action-analyze-backtrace ( bug_id=$(reporter-bugzilla -h `cat duphash`) && if test -n "$bug_id"; then abrt-bodhi -r -b $bug_id fi ) -
Change it to look like this - i.e. add the missing
/usr/libexec/line:EVENT=analyze_LocalGDB analyzer=CCpp abrt-action-analyze-core --core=coredump -o build_ids && /usr/libexec/abrt-action-install-debuginfo-to-abrt-cache --size_mb=4096 && abrt-action-generate-backtrace && abrt-action-analyze-backtrace && ( bug_id=$(reporter-bugzilla -h `cat duphash`) && if test -n "$bug_id"; then abrt-bodhi -r -b $bug_id fi )
Supposedly after everything is configured properly ABRT will install missing debuginfo packages, generate the backtrace and let you report it to Bugzilla. Because of bug 759443 this will not happen.
To work around the problem you can try to manually install the missing debuginfo packages. Go to your system profile in RHN and subscribe the system to all appropriate debuginfo channels. Then install the packages. In my case:
# debuginfo-install firefox
And finally - bug 800754 which was already reported!
There are comments.
Page 7 / 7